Quick answer: In September 2026, buyers across the NWMLS service area had more homes to choose from than at any point since September 2014, and the median sale price held nearly steady at $625,000. In King, Snohomish, Pierce and Kitsap counties, inventory rose 18% to 44% from a year ago, prices held steady or rose slightly, and the market moved closer to balance.
By Erin Corwin, Washington real estate broker, The Corwin Group at Spire One Realty. Published October 15, 2026.
If it feels like there are more For Sale signs around lately, you’re not imagining it. September brought the widest selection of homes in over a decade, and prices held steady.
The Big Picture
Across the Northwest Multiple Listing Service area in September:
- Active listings: 24,965, up 24.5% from last September
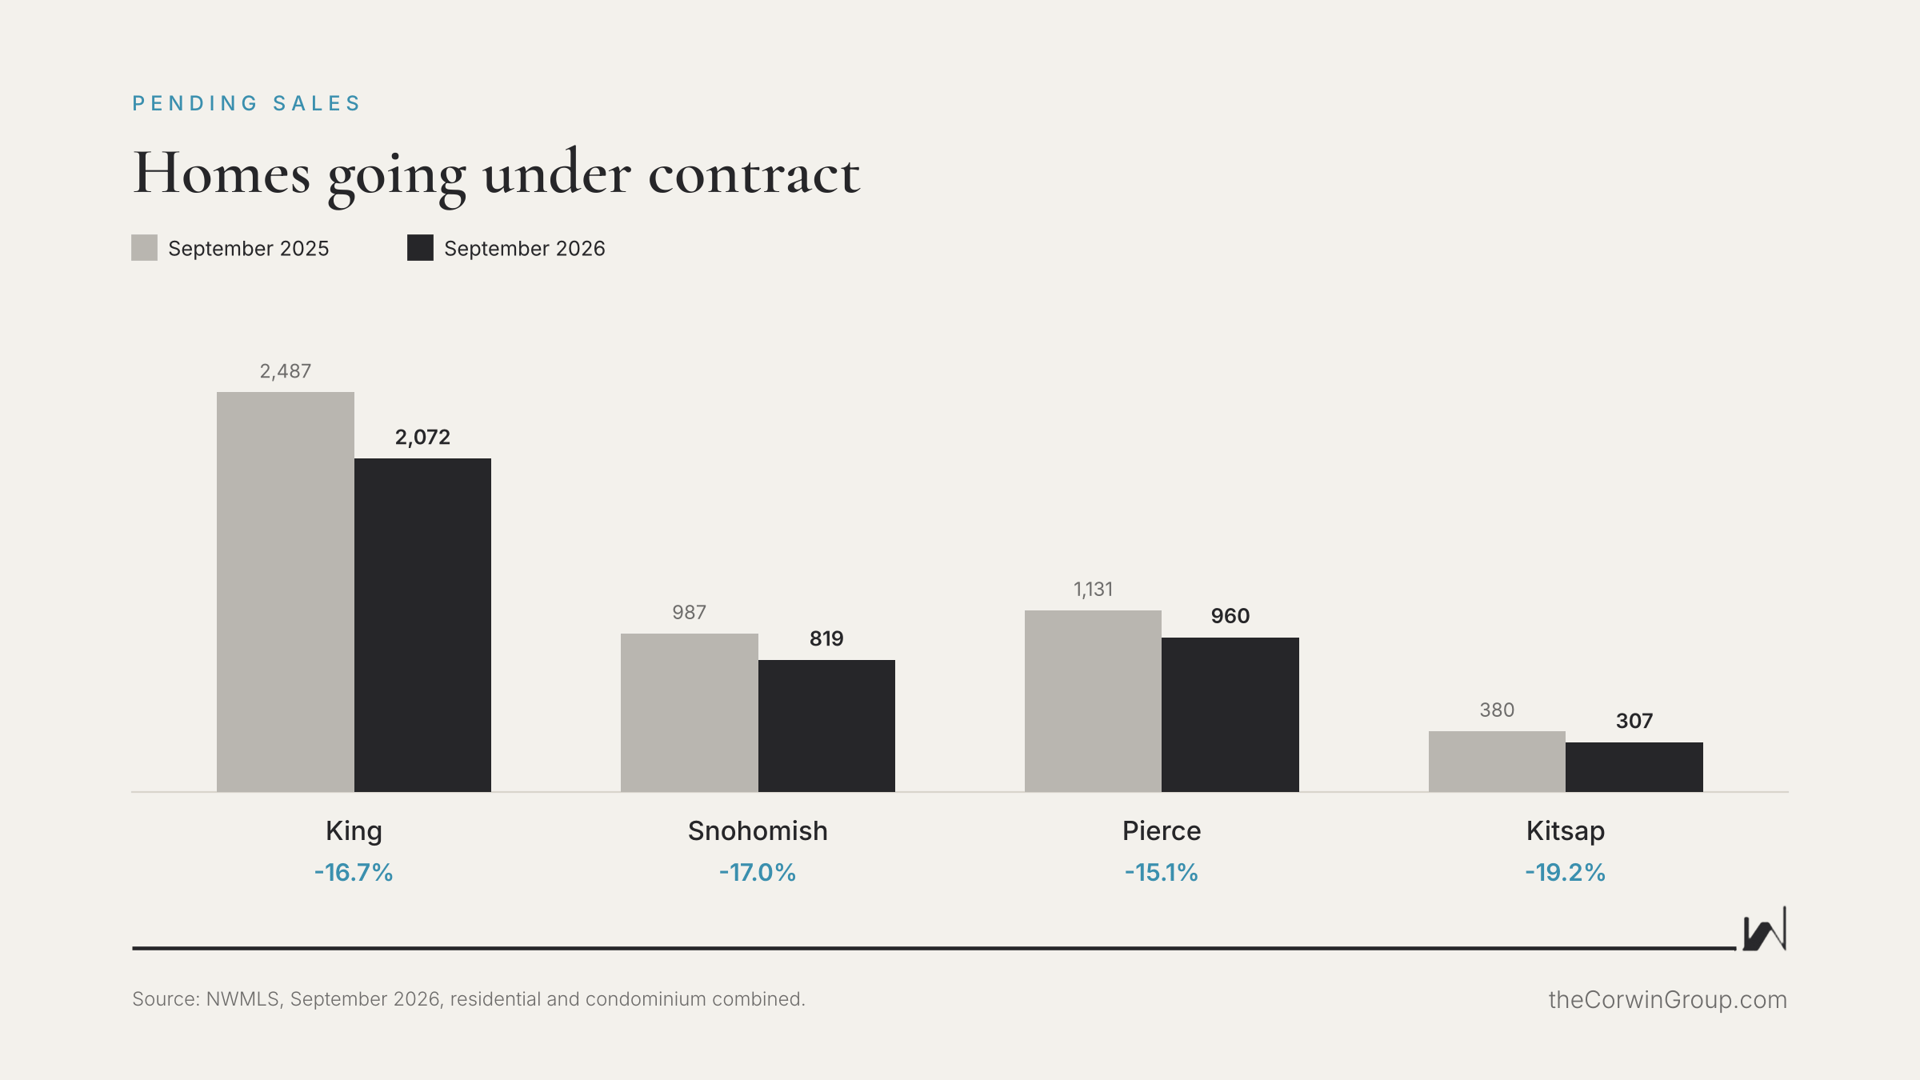
- Pending sales: 6,231, down 15.1%
- Closed sales: 5,623, down 8.9%
- Median sale price: $625,000, down just 0.9%
- Months of inventory: 4.44, the highest since February 2014
Mortgage rates played a role. According to Freddie Mac, the average 30-year fixed rate rose from 6.71% in early September to 7.03% by late month, and reached 7.40% as of October 8.
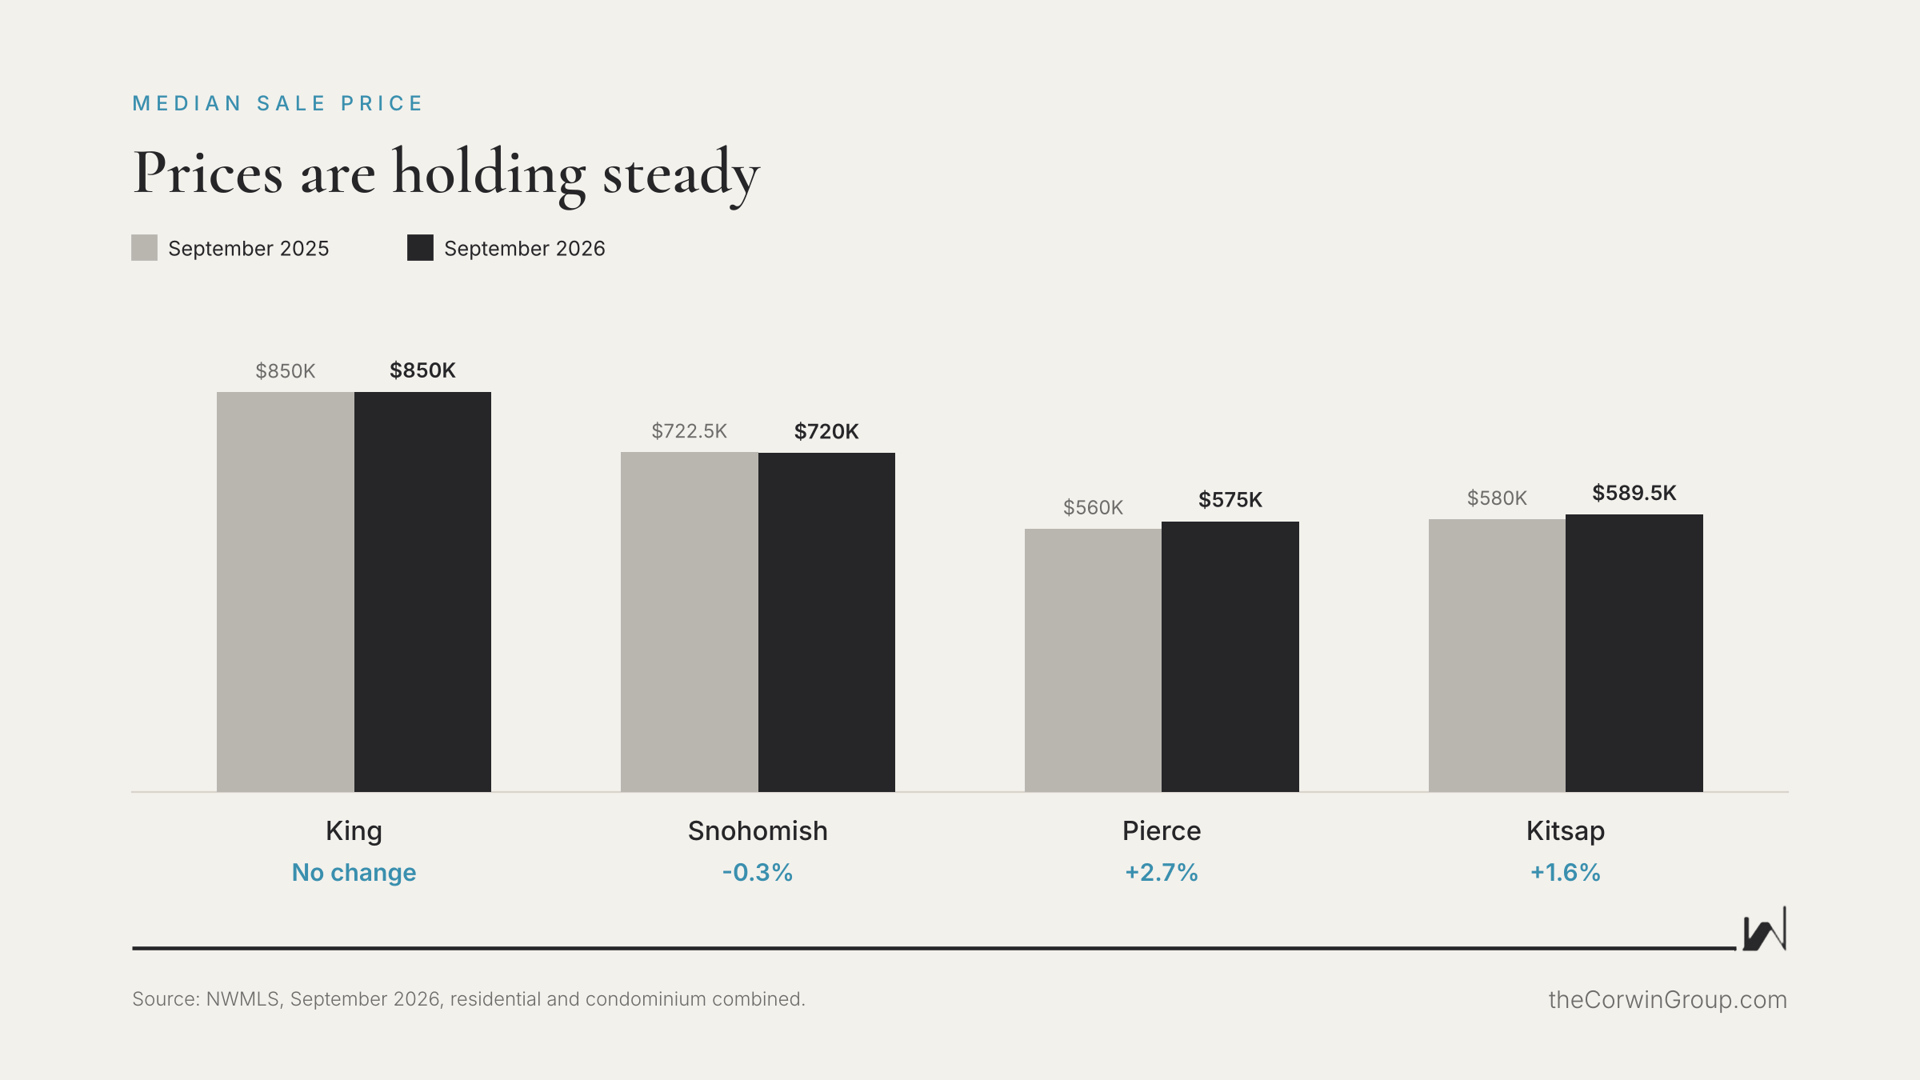
So why are prices holding? The Washington Center for Real Estate Research at the University of Washington points out that prices tend to climb quickly in a strong market but come down slowly when things cool, partly because many sellers have the flexibility to wait. Meanwhile, months of inventory has climbed from 2.8 in March to 4.4 in September.
County by County
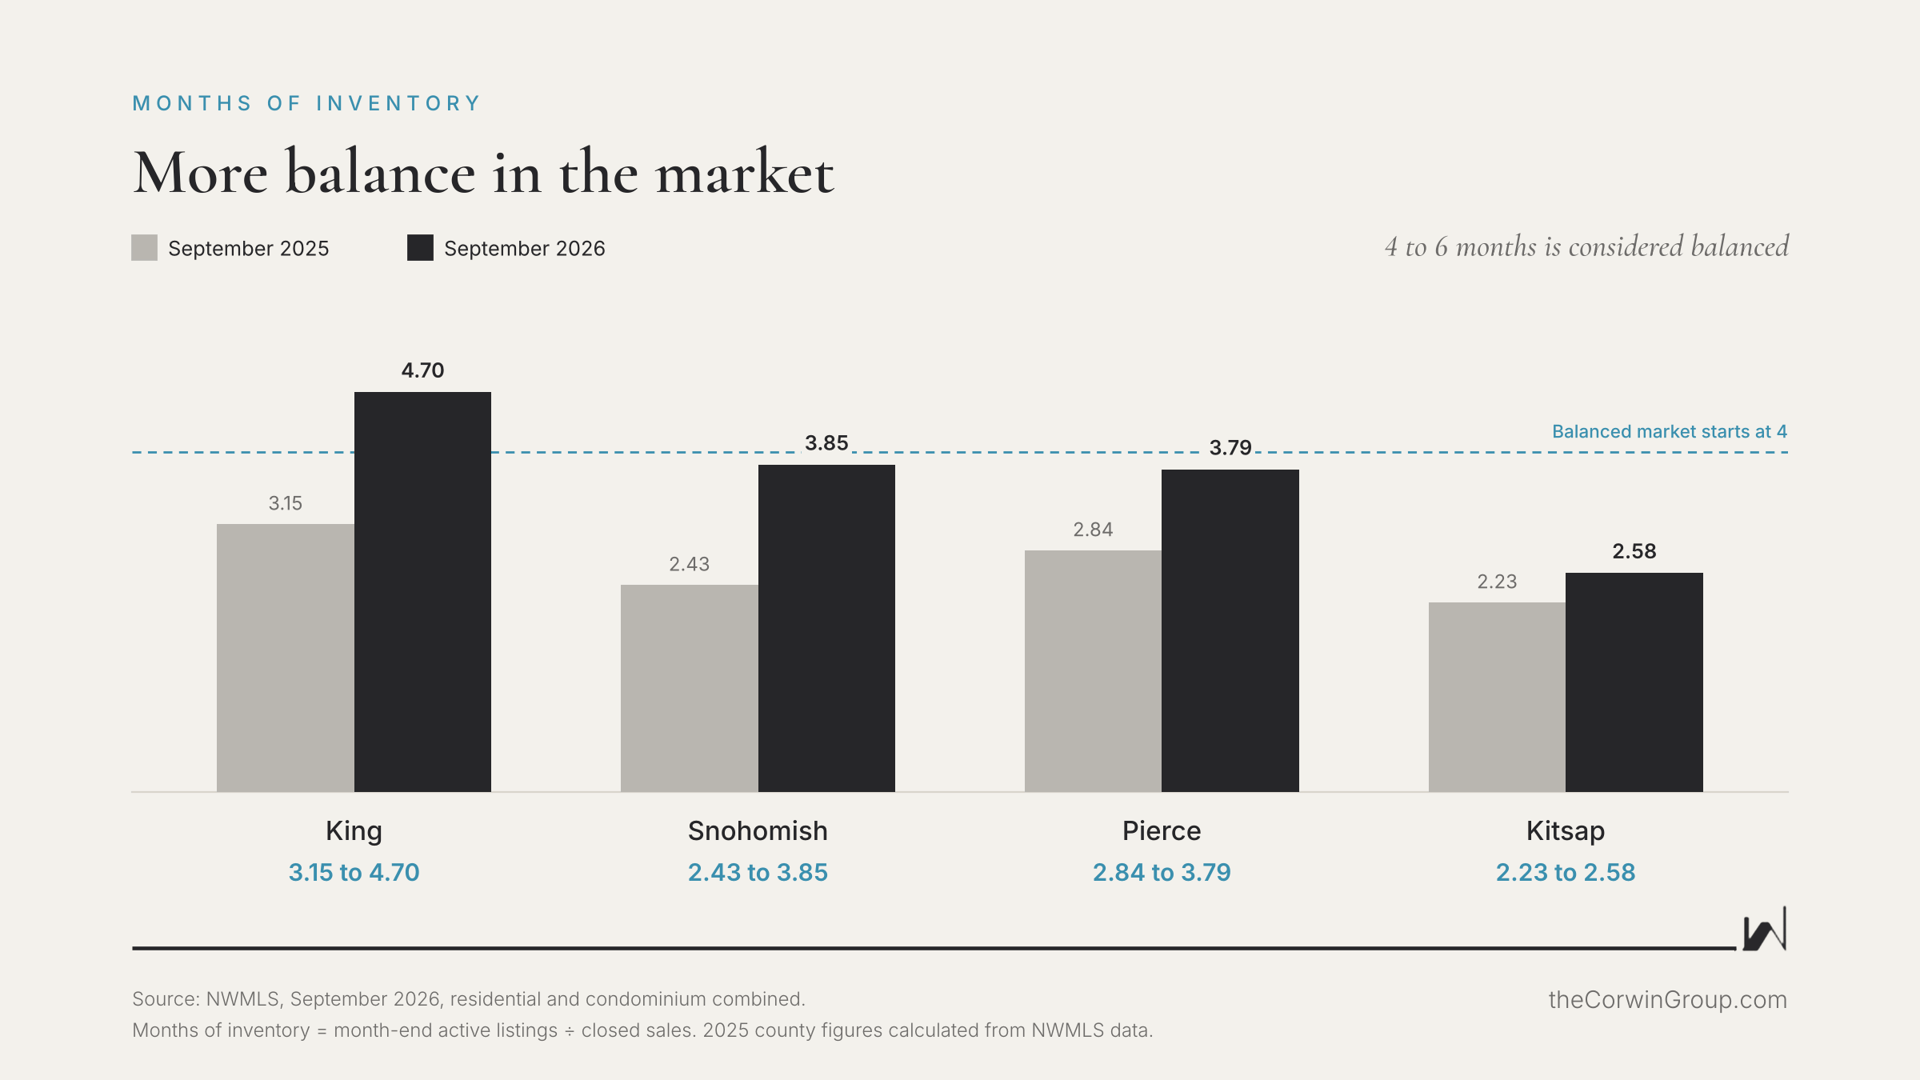
Months of inventory measures how long it would take to sell every active listing at the current sales pace. NWMLS notes that most industry analysts consider four to six months a balanced market. Below four tends to favor sellers, and above six tends to favor buyers.
King County
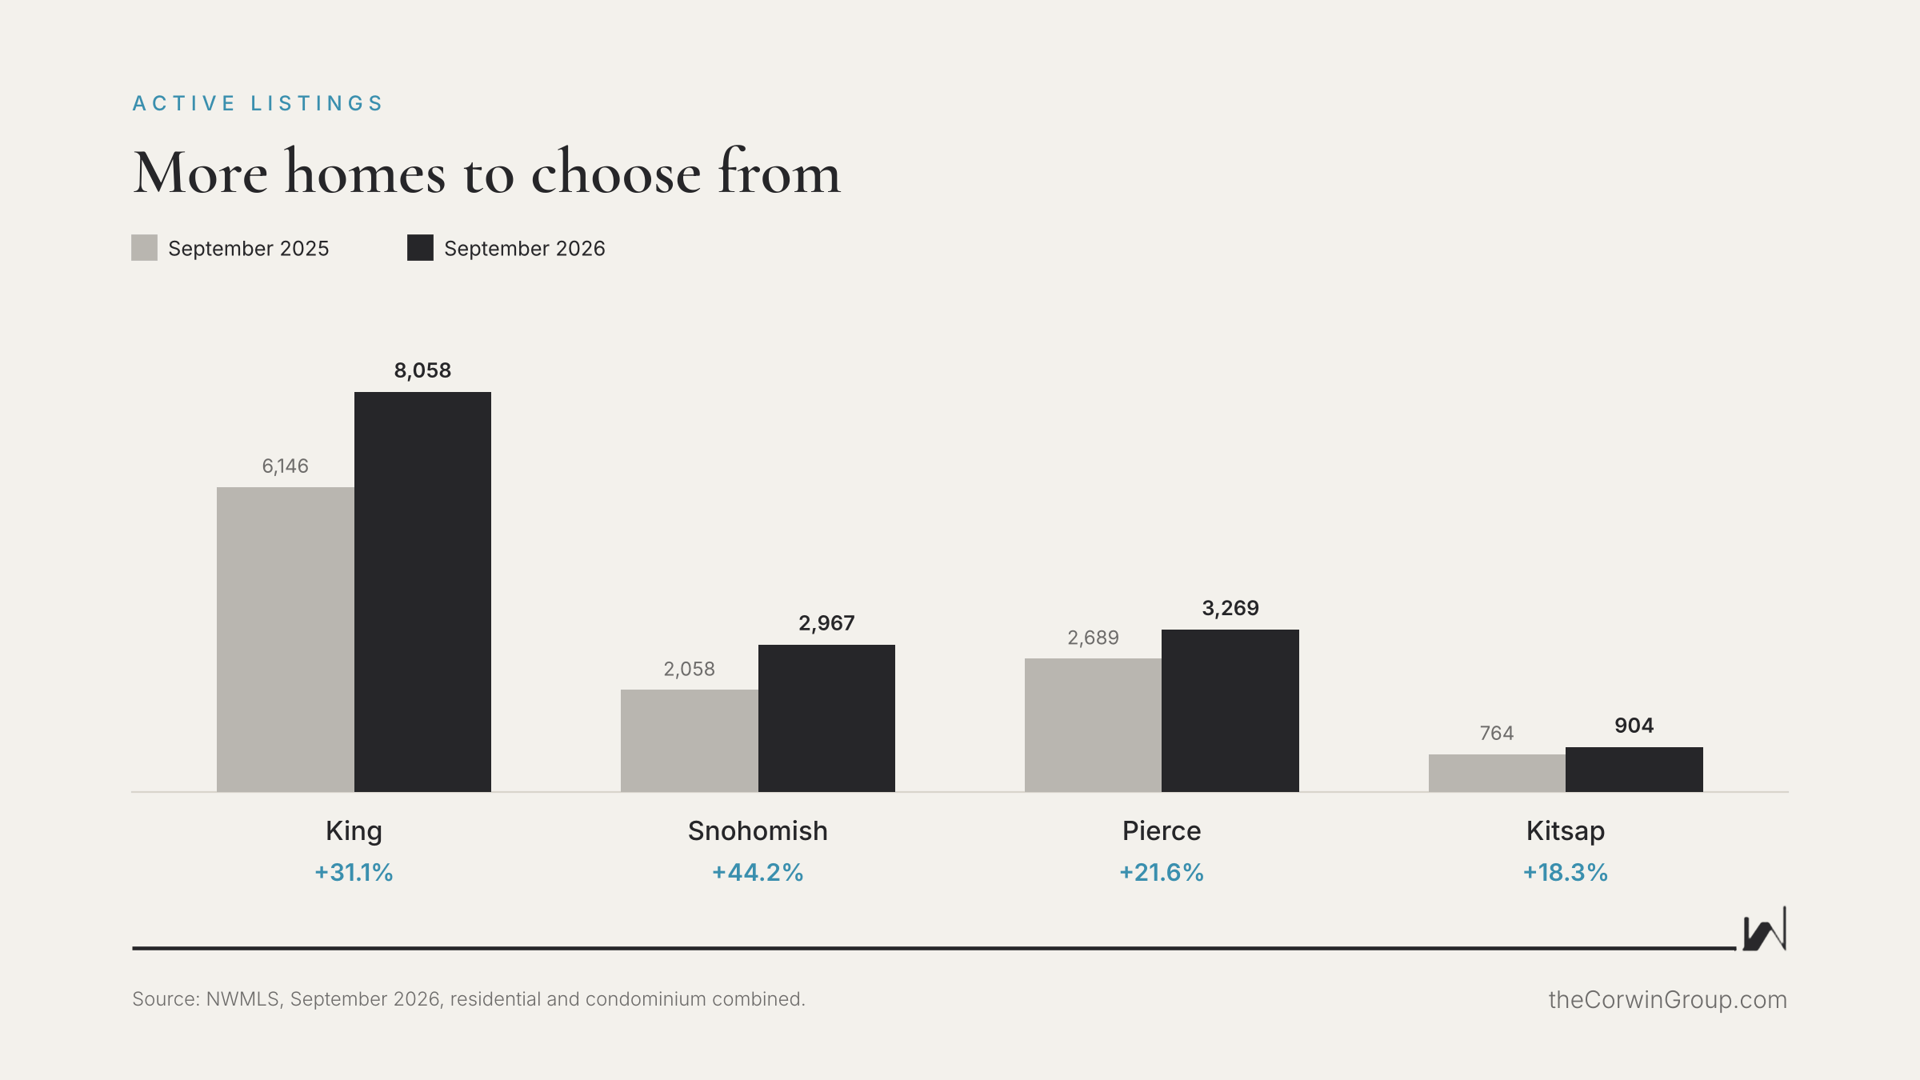
King has the most homes to choose from of the four counties, with 8,058 active listings, up 31.1% from last September. At 4.70 months of inventory, it’s the only one of the four now in balanced territory. Homes averaged 40 days on market compared with 36 a year ago, and the median price held at $850,000. Condo buyers have the most room to negotiate here: King County condos had 7.05 months of inventory, and the median condo price was $496,000, down 6.0%.
Snohomish County
Snohomish saw the biggest jump in selection of the core Puget Sound counties, with active listings up 44.2% to 2,967. The median price held essentially flat at $720,000. At 3.85 months of inventory, Snohomish sits just under balanced, so well-priced homes are still selling, and buyers have noticeably more to choose from than they did a year ago.
Pierce County
Pierce was the only one of the three central Puget Sound counties to post a median price gain, up 2.7% to $575,000. Inventory rose 21.6%, and homes averaged 47 days on market compared with 42 last year. At 3.79 months of inventory, Pierce is close to balanced, and values are holding.
Kitsap County
Kitsap had the tightest supply in the entire NWMLS service area at 2.58 months of inventory. It was the only one of the four counties where closed sales rose (up 2.3%), and homes sold faster than a year ago, averaging 42 days on market compared with 51. The median price rose 1.6% to $589,500. Pending sales were down 19.2%, so it’s worth watching whether buyers there gain more room in the months ahead.
What This Means for Buyers
You have more choice and more time than you’ve had in years. With fewer showings per listing (4.2 on average in September, down from 5.2 a year ago), there’s less competition and more room to negotiate on price, repairs, or a seller credit toward your interest rate. If you’re weighing that last option, my post on rate buydowns walks through how a seller credit can lower your monthly payment.
It’s also worth knowing that 74.7% of listings in the NWMLS database qualified for at least one down payment assistance program in September.
If you’re considering a condo, this is an especially good time to look. The median condo price across the region was $455,000, down 4.7%. Just be sure to review the resale certificate, budget and reserve study carefully before you commit.
What This Means for Sellers
Steady prices mean your equity is holding, and in Pierce and Kitsap it’s still growing. Homes that are priced well and show well are selling: 5,623 closed across the NWMLS area in September. With buyers comparing more options, accurate pricing from day one and a well-prepared home make the difference, and offering concessions like closing cost or rate buydown credits can help your home stand out.
Every Neighborhood Moves Differently
County numbers tell part of the story, but your street, school district and price range tell the rest. If you’re thinking about buying or selling this fall or next spring, I’ll pull the numbers for your specific neighborhood.
Talk through your options: Call or text Erin at 206-650-7390, email [email protected], or visit TheCorwinGroup.com.
Source: Northwest Multiple Listing Service, September 2026 market report and county statistics. Figures reflect residential and condominium listings combined unless noted. Months of inventory is month-end active listings divided by closed sales for the month; September 2025 county figures are calculated from NWMLS data using the same method. Mortgage rates from Freddie Mac’s Primary Mortgage Market Survey.