
Quick answer: In October, the Northwest MLS region reached 4.41 months of inventory, the highest for any October since at least 2014, as active listings rose about 25% and pending sales fell about 18% from a year ago. Prices eased slightly overall, held steady in Pierce County, and the median condo price fell to its lowest level since February 2023.
The October numbers from the Northwest Multiple Listing Service are in, and they show a market that has settled into balanced territory region-wide. Here’s what they mean for buyers and sellers in King, Snohomish, Pierce and Kitsap counties.
The Big Picture
Across the Northwest MLS service area in October:
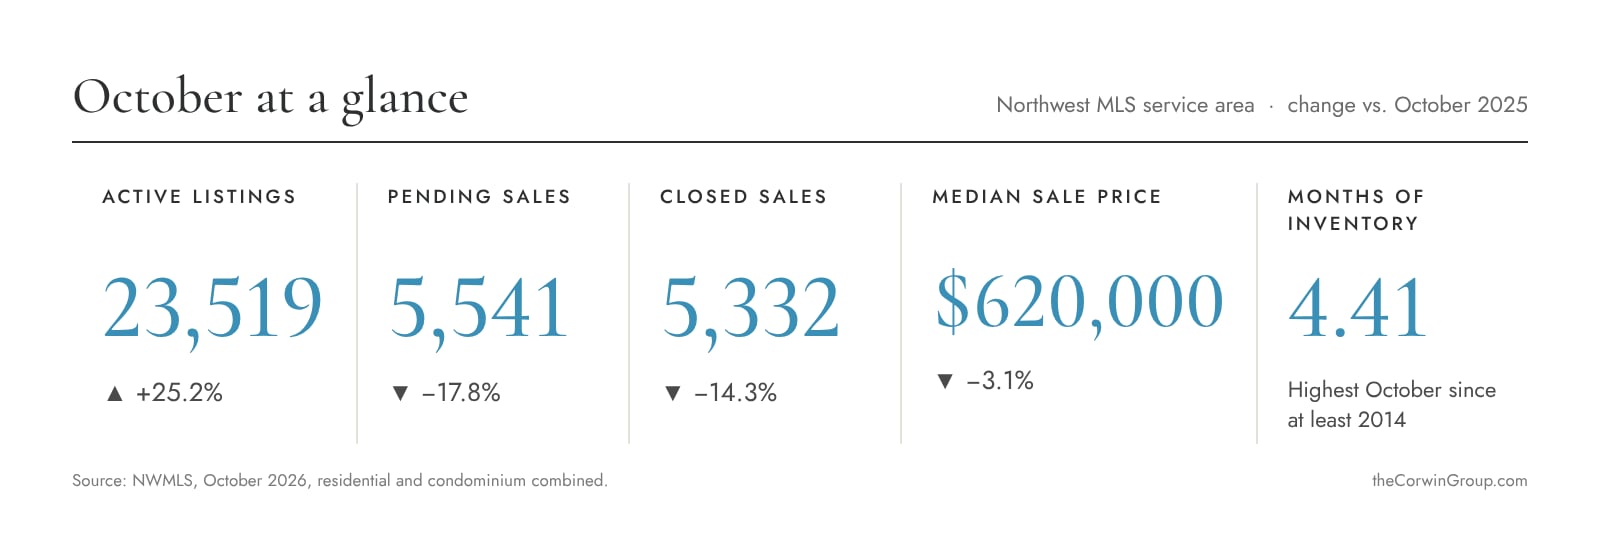
- Active listings rose about 25.2% from a year ago, to 23,519.
- Pending sales fell about 17.8%, to 5,541.
- Closed sales fell about 14.3%, to 5,332.
- The median sale price was $620,000, down about 3.1%.
- Months of inventory reached 4.41, the highest for any October since at least 2014.
New listings were flat compared to a year ago, with 7,991 homes coming on the market both years. So inventory isn’t climbing because of a flood of new sellers. It’s climbing because fewer buyers are going under contract, and that’s what’s giving buyers more room to negotiate. Mortgage rates are part of that story: according to Freddie Mac, the 30-year fixed rate averaged 7.18% as of November 5, down for the third week in a row but still well above the 6.22% average a year ago. Keep in mind, 4.41 months is the region-wide figure. It doesn’t mean every county or property type is balanced.
County by County
Each of our four counties is moving at its own pace. Here’s how they compared in October, with all figures for residential and condominium sales combined unless noted.
King County
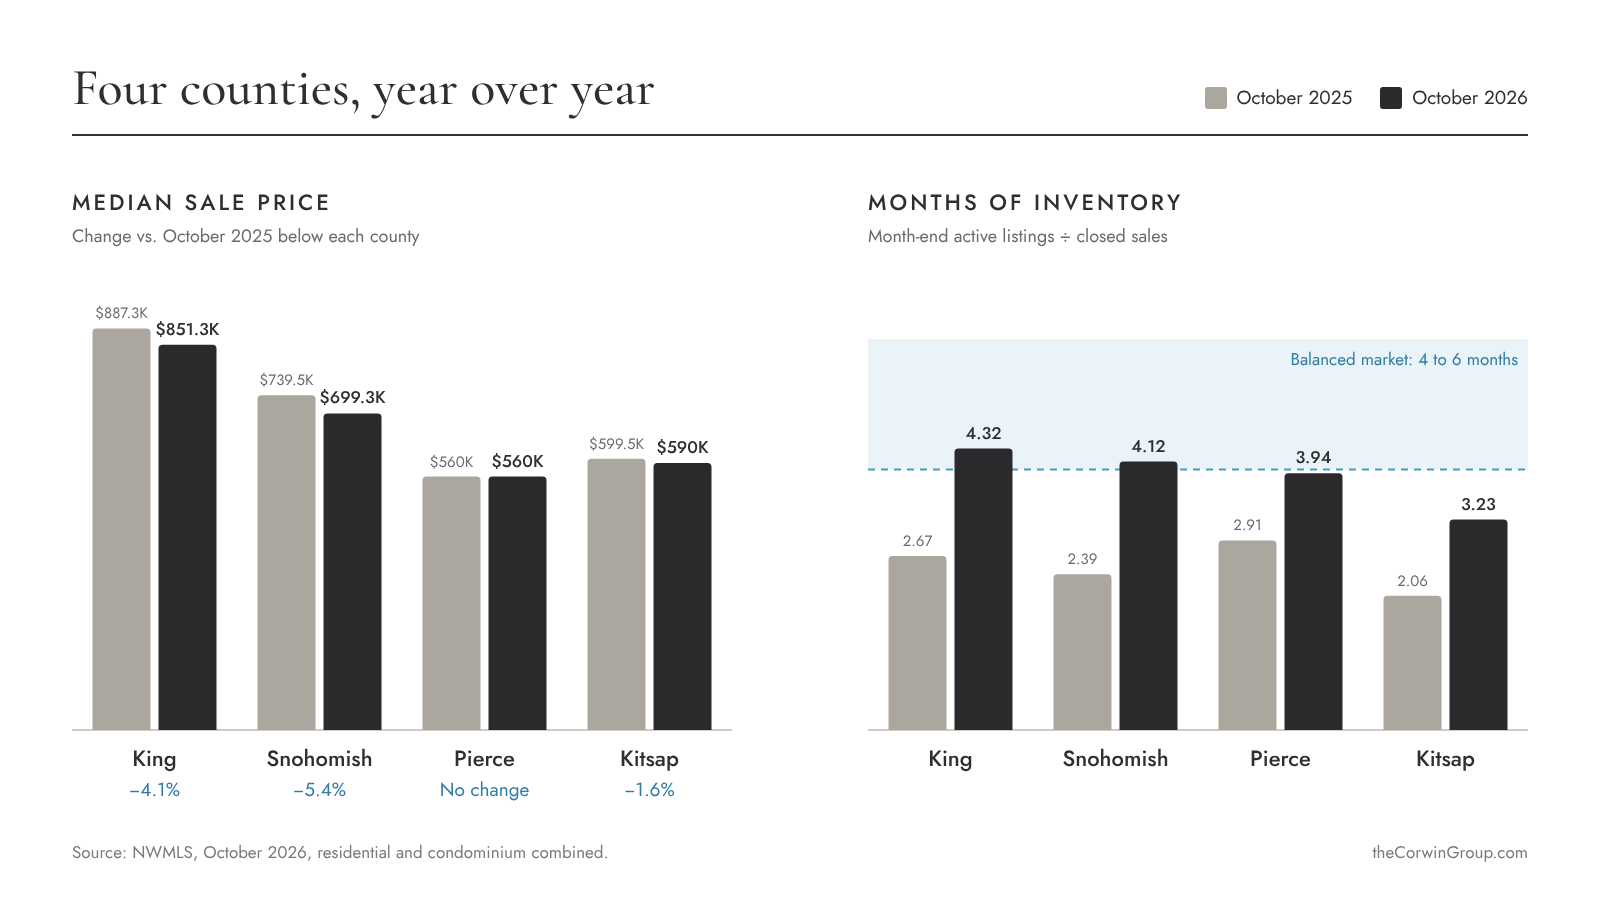
King County had 7,592 homes for sale in October, up about 33% from a year ago, and months of inventory rose to 4.32 from 2.67, putting the county in balanced territory. The median price was $851,250, down about 4.1%. The single-family median was $925,000, down about 7.2% from a strong October last year. Condos are where buyers have the most room, with about 7 months of inventory and a median of $465,000, down about 15.5%.
Snohomish County
Snohomish saw the biggest jump in inventory of the four counties, with active listings up about 41.7% to 2,848. Months of inventory reached 4.12, up from 2.39 a year ago, moving the county into balanced territory after sitting just under four months in September. The median price was $699,250, down about 5.4%.
Pierce County
Pierce is holding up best on price, with a median of $560,000, unchanged from a year ago, and a single-family median of $574,997, up about 0.9%. Active listings rose about 19.7% to 3,098. At 3.94 months of inventory, up from 2.91, Pierce is right at the edge of balanced.
Kitsap County
Kitsap remains the tightest supply in the region at 3.23 months of inventory, up from 2.06 a year ago. Active listings rose about 29% to 868. Pending sales fell about 14.7%, and closed sales fell about 17.5%. The median price was $590,000, down about 1.6%.
New Construction
New construction is still the softest part of the market. In October, the median price of newly built houses that closed was down about 21.2% from a year ago in King County, to $901,074, and down about 14.6% in Snohomish, to $664,995. Pierce held closer to steady, down about 2.8% to $698,400. These figures come from a smaller number of sales each month (168 in King, 85 in Snohomish and 103 in Pierce), so they can swing more than the overall market. Many builders are offering incentives right now, so it’s worth looking at the entire package, including rate buydowns, closing cost help and upgrades, not just the advertised price.
Compared to Last Month
Year-over-year numbers show the bigger shift, but comparing October to September shows how things moved in the last 30 days. Region-wide, the market barely changed: months of inventory went from 4.44 to 4.41, partly because fewer homes were listed for sale in October. At the county level, the balance spread out. Snohomish crossed into balanced territory, Pierce moved closer to four months and Kitsap saw the biggest jump, while King eased slightly as its listings dropped.
September to October:
- NWMLS overall: months of inventory 4.44 to 4.41; median price $625,000 to $620,000
- King: 4.70 to 4.32; $850,000 to $851,250
- Snohomish: 3.85 to 4.12; $720,000 to $699,250
- Pierce: 3.79 to 3.94; $575,000 to $560,000
- Kitsap: 2.58 to 3.23; $589,500 to $590,000
One month doesn’t make a trend. Month-to-month numbers move with the seasons and with which homes happened to sell, so they’re worth watching alongside the year-over-year picture, not instead of it.
What This Means for Buyers
You have something buyers haven’t had in years: more choice and less competition. Homes averaged 4.0 showings per listing in October, down from 4.9 a year ago, so you have more time to compare homes and do your inspection.
There’s also more room to negotiate on price, repairs or seller credits toward rate buydowns that can lower your monthly payment. And if the down payment is the hurdle, 76.2% of listings in the Northwest MLS database qualified for at least one down payment assistance program in October, as long as the buyer qualifies too.
Condos are where buyers have the most leverage right now. Condos across the NWMLS had about 6.6 months of inventory in October, which is buyer’s market territory, and the regional median condo price fell 13% to $435,000, the lowest since February 2023. Before you commit, review the resale certificate, budget and reserve study.
What This Means for Sellers
When the market changes, your strategy has to change too, and for sellers that means pricing to today’s market. Buyers have options and are comparing, so accurate pricing from day one and good presentation matter more than ever. Concessions like closing cost or rate buydown credits can help your home stand out, and in Pierce County, prices held steady. Curious where your home fits? Start with a home valuation or our Seller’s Guide.
Every Neighborhood Moves Differently
Regional and county numbers are a starting point, but your neighborhood, price point and type of home can tell a different story. If you’re curious what this means for your home, or your next one, let’s look at the numbers for your neighborhood. You can also search current listings.
Talk through your options: Call or text Erin at 206-650-7390, email [email protected], or visit TheCorwinGroup.com.
Source: Northwest Multiple Listing Service, October 2026 compared with October 2025 (and with September 2026 where noted), residential and condominium combined unless noted. Mortgage rates from the Freddie Mac Primary Mortgage Market Survey, November 5, 2026. All information is deemed reliable but not guaranteed and should be independently reviewed and verified.